Using AI to Map Methane Emissions
Methane emissions have been identified as being responsible for 30 percent of Earth’s warming
From the COE/CLS Convergence magazine (S23) article - "Focus On: The Rise of AI – 'Using AI to Map Methane Emissions'"
At the 2022 World Climate Summit, methane emissions were identified as being responsible for 30 percent of Earth’s warming. “To put that into perspective,” says Satish Kumar, a fifth-year PhD student in the Vision Research Lab (VRL), led by B. S. Manjunath, distinguished professor and chair of the Electrical and Computer Engineering Department at UC Santa Barbara, “The amount of damage to the environment that CO2 will do in 100 years, methane can do in just 1.2 years.” The problem has worsened in the U.S. since about 2010, when domestic oil and natural-gas production exploded.
Manjunath, a pioneer in the field of big-image-data management and director of the Center for Multimodal Big Data Science and Healthcare, was recently elected to the National Academy of Inventors (NAI). In the realm of multimodal big data, he developed the open-source BisQue (Bio-Image Semantic Inquiry User Environment) image informatics platform, the intent of which was, he says, “to enable reproducible computer vision [a main topic of AI research], bringing together data, annotations, and methods so that researchers could reproduce their results at anytime.
To help address the methane problem, Kumar developed a computer-vision/AI model, called the MethaneMapper (the data and AI models are distributed through the BisQue software platform), to detect emissions from two key sources: the gas and oil sector, which make up 36 percent of total methane emissions in the U.S., and agriculture and dairy farms, which account for 26 percent. He is the lead author on a scientific paper about the MethaneMapper that will be featured as a “Highlight Paper” at the 2023 Computer Vision and Pattern Recognition (CVPR) Conference, the premiere event in the computer-vision field, to be held this June in Vancouver, British Columbia.
Several methane-monitoring systems are currently in place, but existing methods for analyzing those images are not scalable, because they are prone to significant error and must be inspected by domain experts. MethaneMapper does everything automatically.
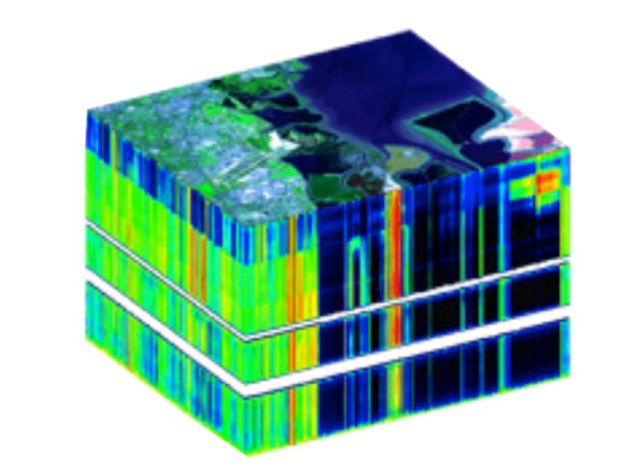
Kumar proposes what the paper describes as “a novel end-to-end spectral absorption wavelength aware transformer network…that introduces novel modules to help locate the most relevant methane plume regions.” One module transforms what is called a HyperSpectral data cube into an aerial map displaying the location of a methane plume on the ground. Says Manjunath, “Our vision is to scale this analysis to the global level, using satellite images.”
Illustration Caption: The stacked images of a HyperSpectral data cube reveal specific elements on Earth, such as methane plumes.
Kumar's Vision Research Lab Profile
Manjunath's Center for Multimodal Big Data Science and Healthcare